Weather Forecast for the region of Boothville-Venice in USA
Venice LA - Deepwater Horizon Oil Rig - Port Sulphur - Breton National Wildlife Refuge - Oil Spill

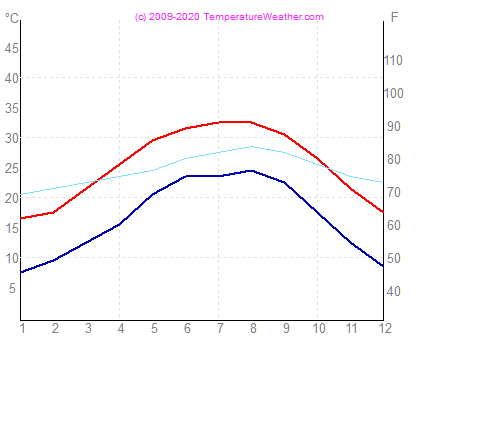
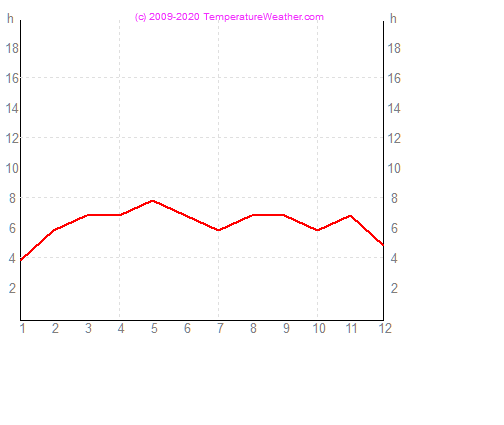
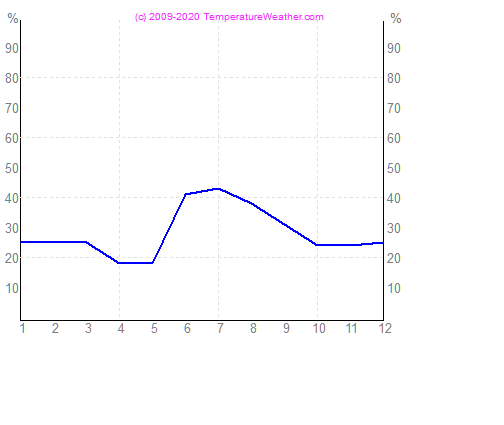
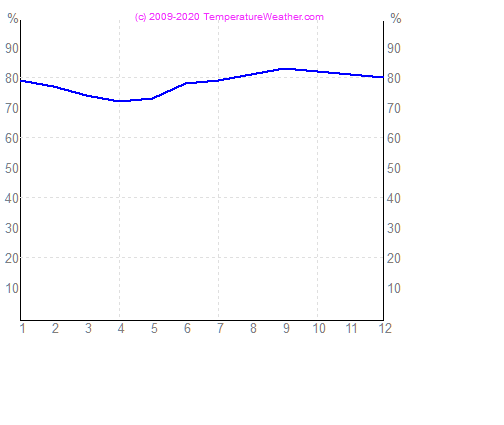
Average monthly weather data for the region of Boothville-Venice in USA
| Minimum Temperature | Maximum Temperature | Water Temperature | Sunshine Hours | Probability of Rain | Humidity | |
| January | 8°C 46°F | 17°C 63°F | 21°C 70°F | 4 | 26% | 80% |
| February | 10°C 50°F | 18°C 64°F | 22°C 72°F | 6 | 26% | 78% |
| March | 13°C 55°F | 22°C 72°F | 23°C 73°F | 7 | 26% | 75% |
| April | 16°C 61°F | 26°C 79°F | 24°C 75°F | 7 | 19% | 73% |
| May | 21°C 70°F | 30°C 86°F | 25°C 77°F | 8 | 19% | 74% |
| June | 24°C 75°F | 32°C 90°F | 27°C 81°F | 7 | 42% | 79% |
| July | 24°C 75°F | 33°C 91°F | 28°C 82°F | 6 | 44% | 80% |
| August | 25°C 77°F | 33°C 91°F | 29°C 84°F | 7 | 39% | 82% |
| September | 23°C 73°F | 31°C 88°F | 28°C 82°F | 7 | 32% | 84% |
| October | 18°C 64°F | 27°C 81°F | 26°C 79°F | 6 | 25% | 83% |
| November | 13°C 55°F | 22°C 72°F | 24°C 75°F | 7 | 25% | 82% |
| December | 9°C 48°F | 18°C 64°F | 23°C 73°F | 5 | 26% | 81% |
Maximum Temperature = Average maximum temperature of the recent years in Boothville-Venice. The temperature may sometimes be higher or lower.
Water Temperature = Average water temperature of the recent years in Boothville-Venice. The temperature may be sometimes below or above this value. On shallow beaches, the temperature will be higher in summer.
Sunshine Hours = Average number of sunshine hours per day in Boothville-Venice.
Probability of Rain = The average daily probability of rain in Boothville-Venice.
Humidity = The average humidity in Boothville-Venice. Depending on the actual wind and the sunshine amount, the value may be higher or lower.


